Essential Facebook Analytics Report for Marketer. Facebook Analytics is a robust tool that lets marketers explore users’ interactions with advanced goal paths and sales funnels for Facebook advertisements. So, the FB analytics report for marketers will be good for those who need their business to be advertised.
Your business needs Facebook analytic reports to grow very well. Every business has a growth model that increases a set of goals to make it flourish. For instance, your goals may be related to daily/weekly/monthly active users for an app. Or your business goal might be related to posts, social media shares, and reactions.
Essential Facebook Analytics Report for Marketer
The best way of Analytics is to set up and measure progress toward goals for business growth. You need to choose goals that bring you profit, properly set up goals in your analytics system to make sure everything is set up correctly.
No matter what you want to analyze—a website, an app, your Facebook page, a combination of channels, or even offline events—make sure you set up your analytics system correctly. If you want to acquire relevant data and get accurate results, set up your Facebook tracking tag.
The following are amazing essential Facebook Analytics reports for marketers:
Funnel Reports informing Budget and Ad Spend Decision Through Facebook Analytics
Funnels help you experience the smoothness of your customer journey. They permit you to see if people feel comfortable reaching their goals or if they decide to leave even before they take the first step.
With Facebook Analytics you can set up the funnels you are interested in. to create a funnel of events, you have to:
- visit Activity>Funnels to open the funnel report.
- Then click Create Funnel.
- Now choose an event to start building your funnel
- To illustrate, the structure of the funnel below is search> Content View?> add to Cart> Purchases
After that, with the Facebook analytics funnel report, you can reallocate your advertisement budget. Not only that, it will direct you to the group that converts most.
Assess Overlap Reports to inform Audience Targeting through Facebook Analytics
Overlap report in Facebook Analytics will help you advertise your goods and change your targeting options to save money for each channel. This process is very simple and easy to see an overview of all of your data sources on Facebook Analytics. It displays the names, traffic, numbers, and retention rates for each source.
The Overlap report is one of the modest and most powerful tools you can use to create advertising and audiences to work with. It lets you see users who take actions across channels. It helps to give you a true understanding of cross-device and cross-platform customer behavior so that you can find insights for narrowing or broadening your targeting.
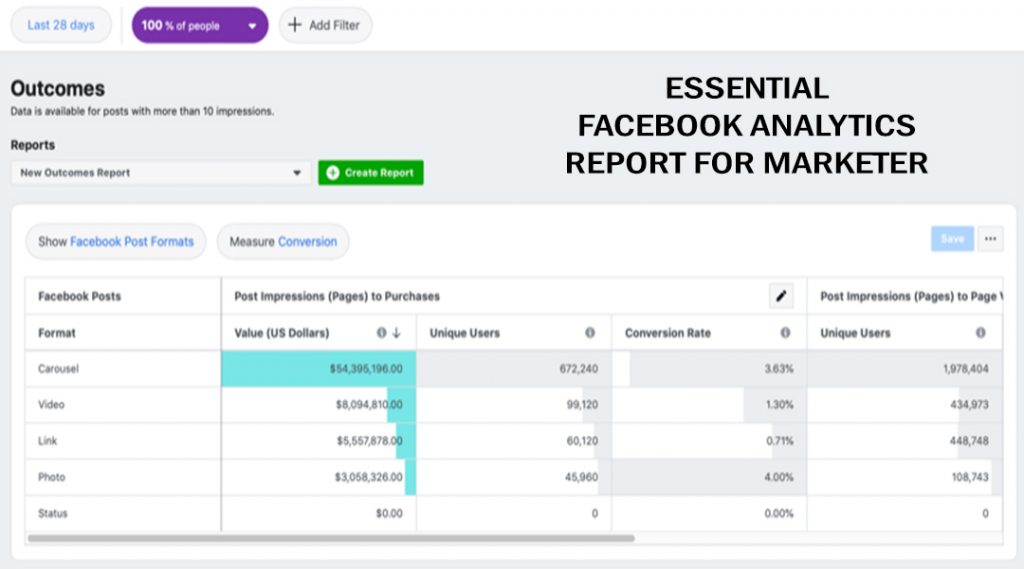
Outcome Reports to Reveal Successful Content, Format, and Posts through Facebook Analytics
In this outcome report, am going to show you how to choose the best content for advertising on Facebook. Have you thought of the amount and profit each of your Facebook posts will bring to you?
It might sound strange but marketers who work Facebook Analytics can test a new feature called outcomes. Just go to Activity> outcomes to access this data.
The Outcome is essential equipment for social media markets who have a gut feeling about which pieces of content are good.
Retention Reports to Monitor Consumer Engagement by Cohort
You will have to examine Facebook Analytics user retention reports to monitor consumer engagement by Cohort. Cohorts segment users into groups built on the period elapsed since they first came in contact with your product. The more users are making use of cohort, the better.
Facebook Analytics helps you monitor your holding rate by sharing and dicing your data, considering dozens of possible criteria, so you can see the positive or negative trends.
With the user’s Retention report, users can see the percentage of people who stay interested in your product or content over time. To access this report, you need to go to Activity> Retention in the Navigation on your Facebook account.
Keep in mind that in the cohorts report, you can build any cohort for your marketing experiments and use it at any time.
Demographic Reports to Reveal Possible Business Partnerships
You can view Facebook Analytics Demographics Reports to Reveal Possible Business Partnerships. The curiosity and creativity can unleash with analytics tools that will help you to see insights where you never expected them and apply those insights in the most profitable way.
How can you be creative with Facebook Analytics?
Facebook users share an enormous amount of data every day. And all these combined and anonymized resources are obtainable in a Demographics report in Facebook Analytics. To be able to access demographic data, marketers need to use household information like Job title, Relationship Status, and Education level.
Conclusion
Facebook Analytics offers enough features to be a productivity, centric stand-alone tool. It has no limit to the number of tracked events, is free to use, and does not need you to use a Facebook login.


